


 5 / 11

`
4
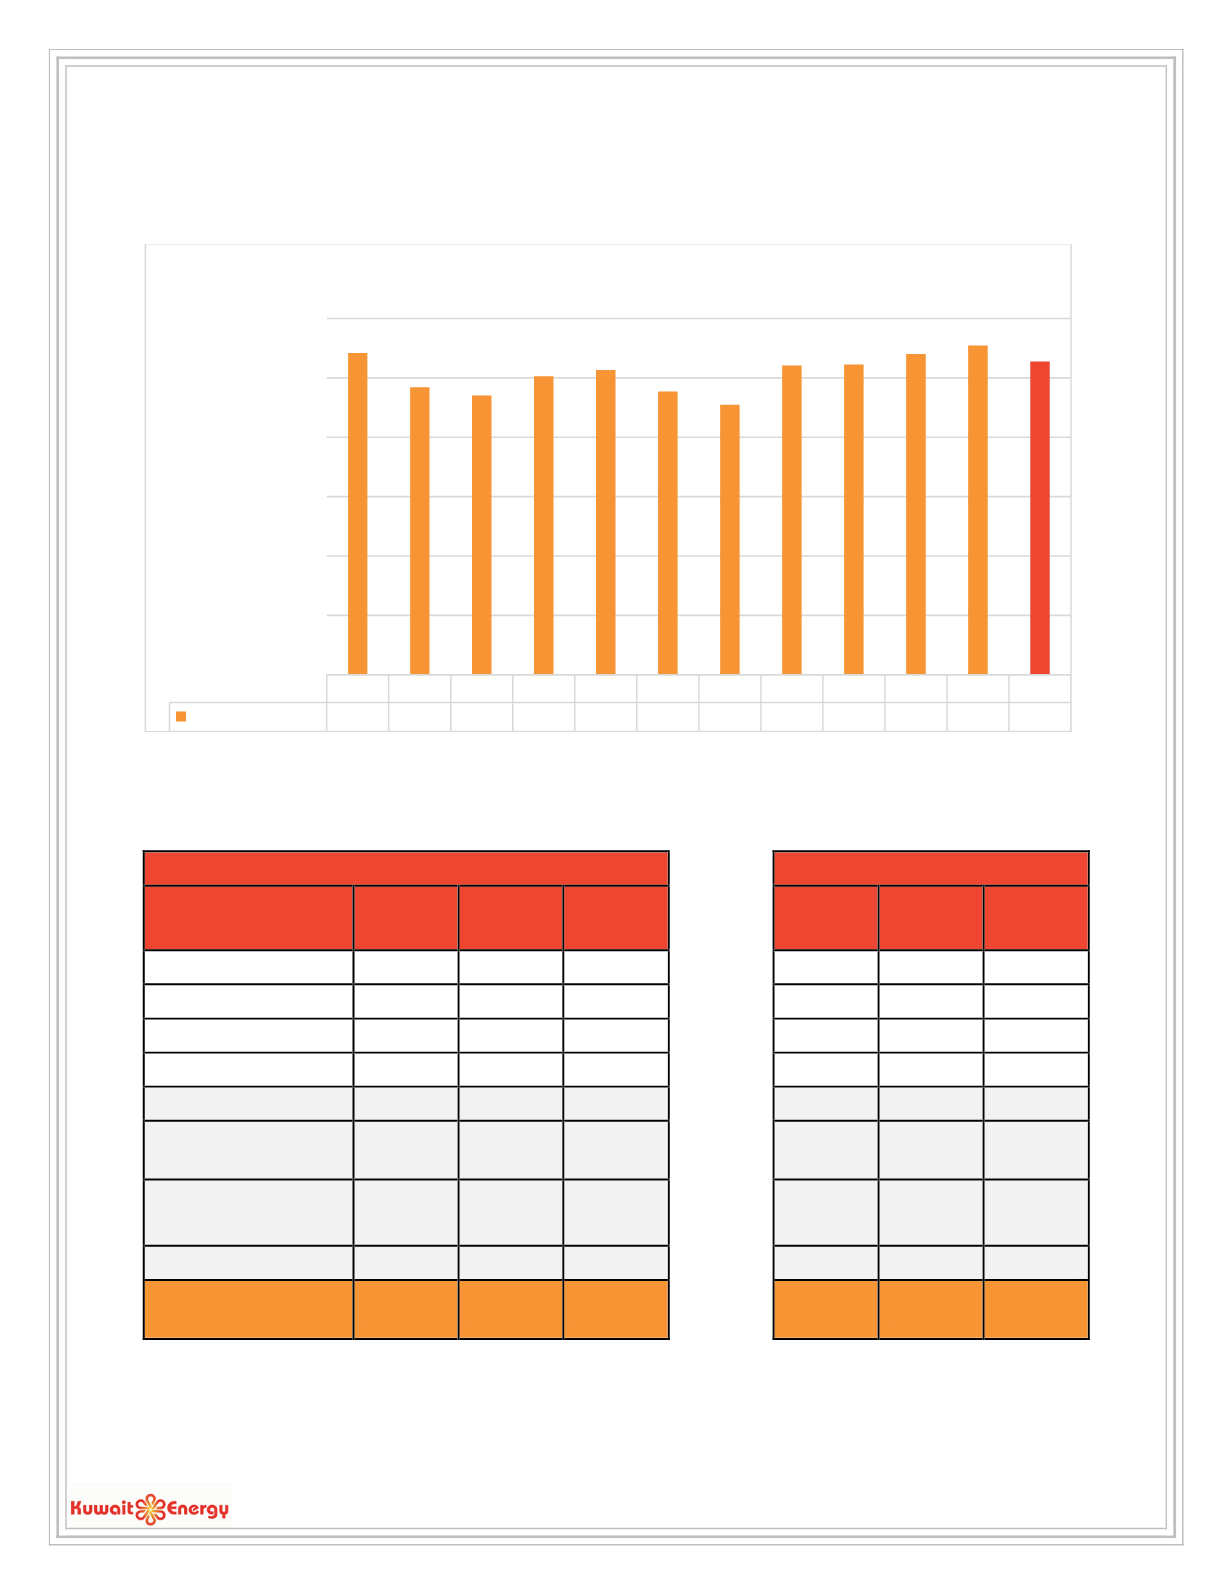
The chart below shows the
quarter-by-quarter average daily WI production
of the Company from Q1 2015 to Q4
2017:
¹2017 figures have been updated to take into consideration the farm-down of Abu Sennan effective 31 December 2016
Kuwait Energy’s daily average WI share of production for all of
2017
compared to
2016,
and a
comparison of the
last two quarters daily production averages
per asset are shown in the tables below (in boepd):
Year on Year Comparison
Quarter on Quarter Comparison
¹
2017
¹
2016
% Change
Q4 2017
Q3 2017
% Change
Abu Sennan
867
1,772
-51.1
952
848
12.3
BEA
1,257
1,363
-7.8
1,462
1,276
14.6
Area A
4,654
5,055
-7.9
4,463
4,716
-5.4
ERQ
8,081
9,843
-17.9
7,225
7,831
-7.7
Egypt Total
14,859
18,033
-17.6
14,102
14,671
-3.9
Iraq Total
(Block 9)
9,583
3,974
141.1
10,059
10,606
-5.2
Oman Total
(Karim Small Fields)
2,377
2,444
-2.7
2,233
2,454
-9.0
Yemen Total²
0
0
-
0
0
-
Production Total
26,819
24,451
9.7
26,394
27,731
-4.8
¹
2017 production total and quarter on quarter data reflective of the 25% farm-out of Abu Sennan to GlobalConnect effective 31 December 2016
² Yemen production has been suspended since April 2015
Q1 15 Q2 15 Q3 15 Q4 15 Q1 16 Q2 16 Q3 16 Q4 16 Q1 17 Q2 17 Q3 17 Q4 17
Avg WI producion 27,099 24,223 23,522 25,151 25,679 23,859 22,742 26,041 26,123 27,014 27,731 26,394
0
5,000
10,000
15,000
20,000
25,000
30,000
Quarter-by-Quarter Average Daily WI Production¹