


 4 / 12

4
Health, Safety, Sustainability and Environment
Kuwait Energy classifies its recordable incidents as Lost Time Incidents – Fatalities
and Injuries (“LTI”), Restricted Work Incidents (“RWI”) and Medical Treatment
Incidents (“MTI”).
Three recordable incidents took place in Q2 2015. The table provides days without
LTI at the end of Q2 2015, for countries in which Kuwait Energy operates.
Production
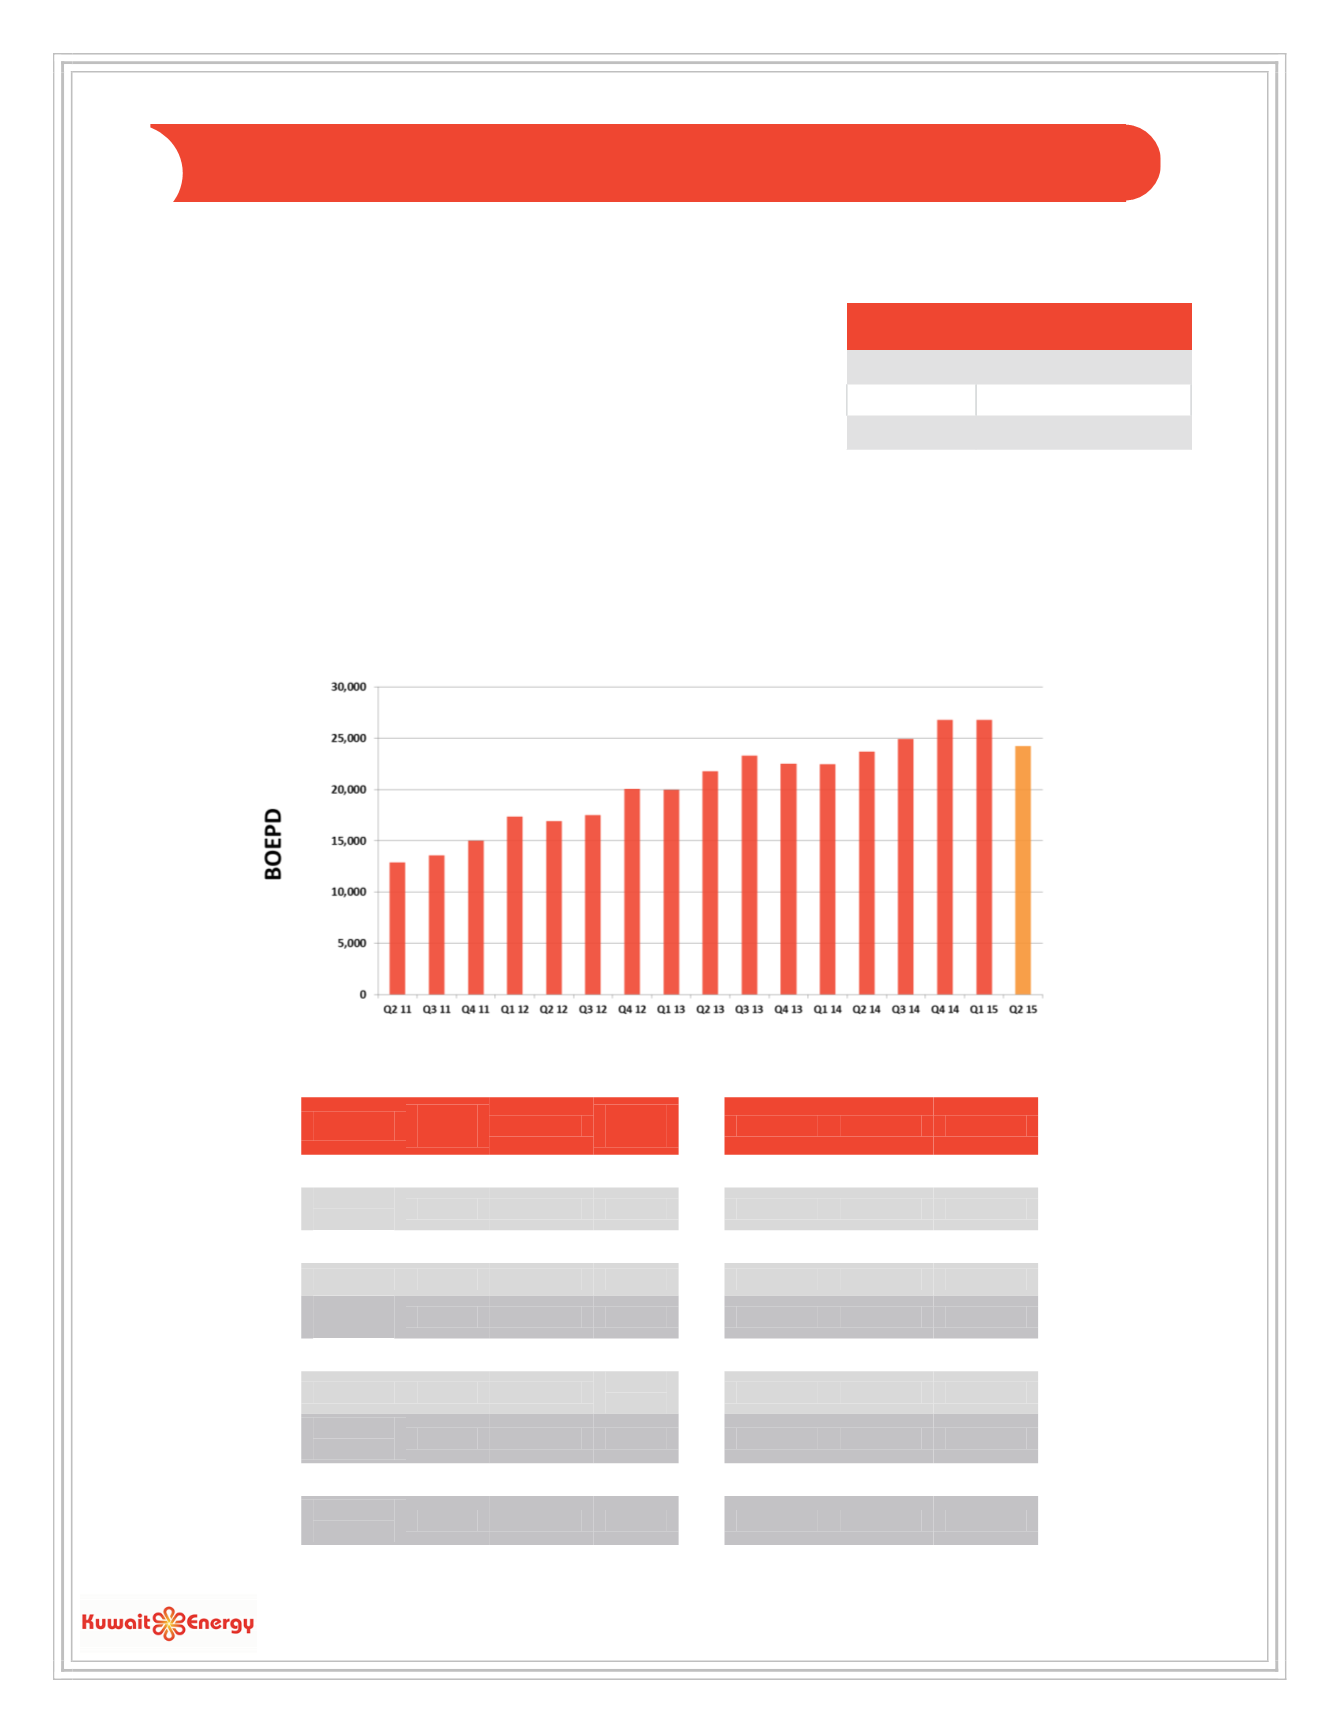
Kuwait Energy achieved a quarterly average daily Working Interest production of 24,223 barrels of oil equivalent per day
(“boepd”) that is 10.61% less than the previous quarter and 2.12% higher than the corresponding quarter of last year.
The chart below shows quarter-by-quarter daily Working Interest average production of the Company
from Q2 2011 to Q2 2015:
Kuwait Energy’s daily average WI share of production for Q2 2015 compared to Q1 2015 and Q2 2014
per asset is shown in
the table below (in boepd):
Q2
2015
2
Q1 2015
2
%
Change
Q2 2015
Q2 2014
% Change
BEA
1,563
1,282
21.92%
1,563
1,406
11.17%
Abu
Sennan
3,401
2,093
62.49%
3,401
548
520.62%
Area A
4,611
4,484
2.83%
4,611
4,505
2.35%
ERQ
12,076
12,774
-5.46%
12,076
10,781
12.01%
Egypt
Total
21,652
20,633
4.94%
21,652
17,240
25.59%
Block 5
73
3,618
-97.98%
73
3,576
-97.96%
Block 43
0
266
-
100.00%
0
366
-100.00%
Yemen
Total
73
3,884
-98.12%
73
3,942
-98.15%
Oman
2,498
2,582
-3.25%
2,498
2,538
-1.58%
Production
Total
24,223
27,099
-10.61%
24,223
23,720
2.12%
O
PERATIONAL
A
CTIVITY
Country
Dayswithout LTI
Iraq
266
Yemen
26
Egypt
748
2
Figures adjusted taking into account the acquisition of 25% WI in BEA.