


 4 / 10

4
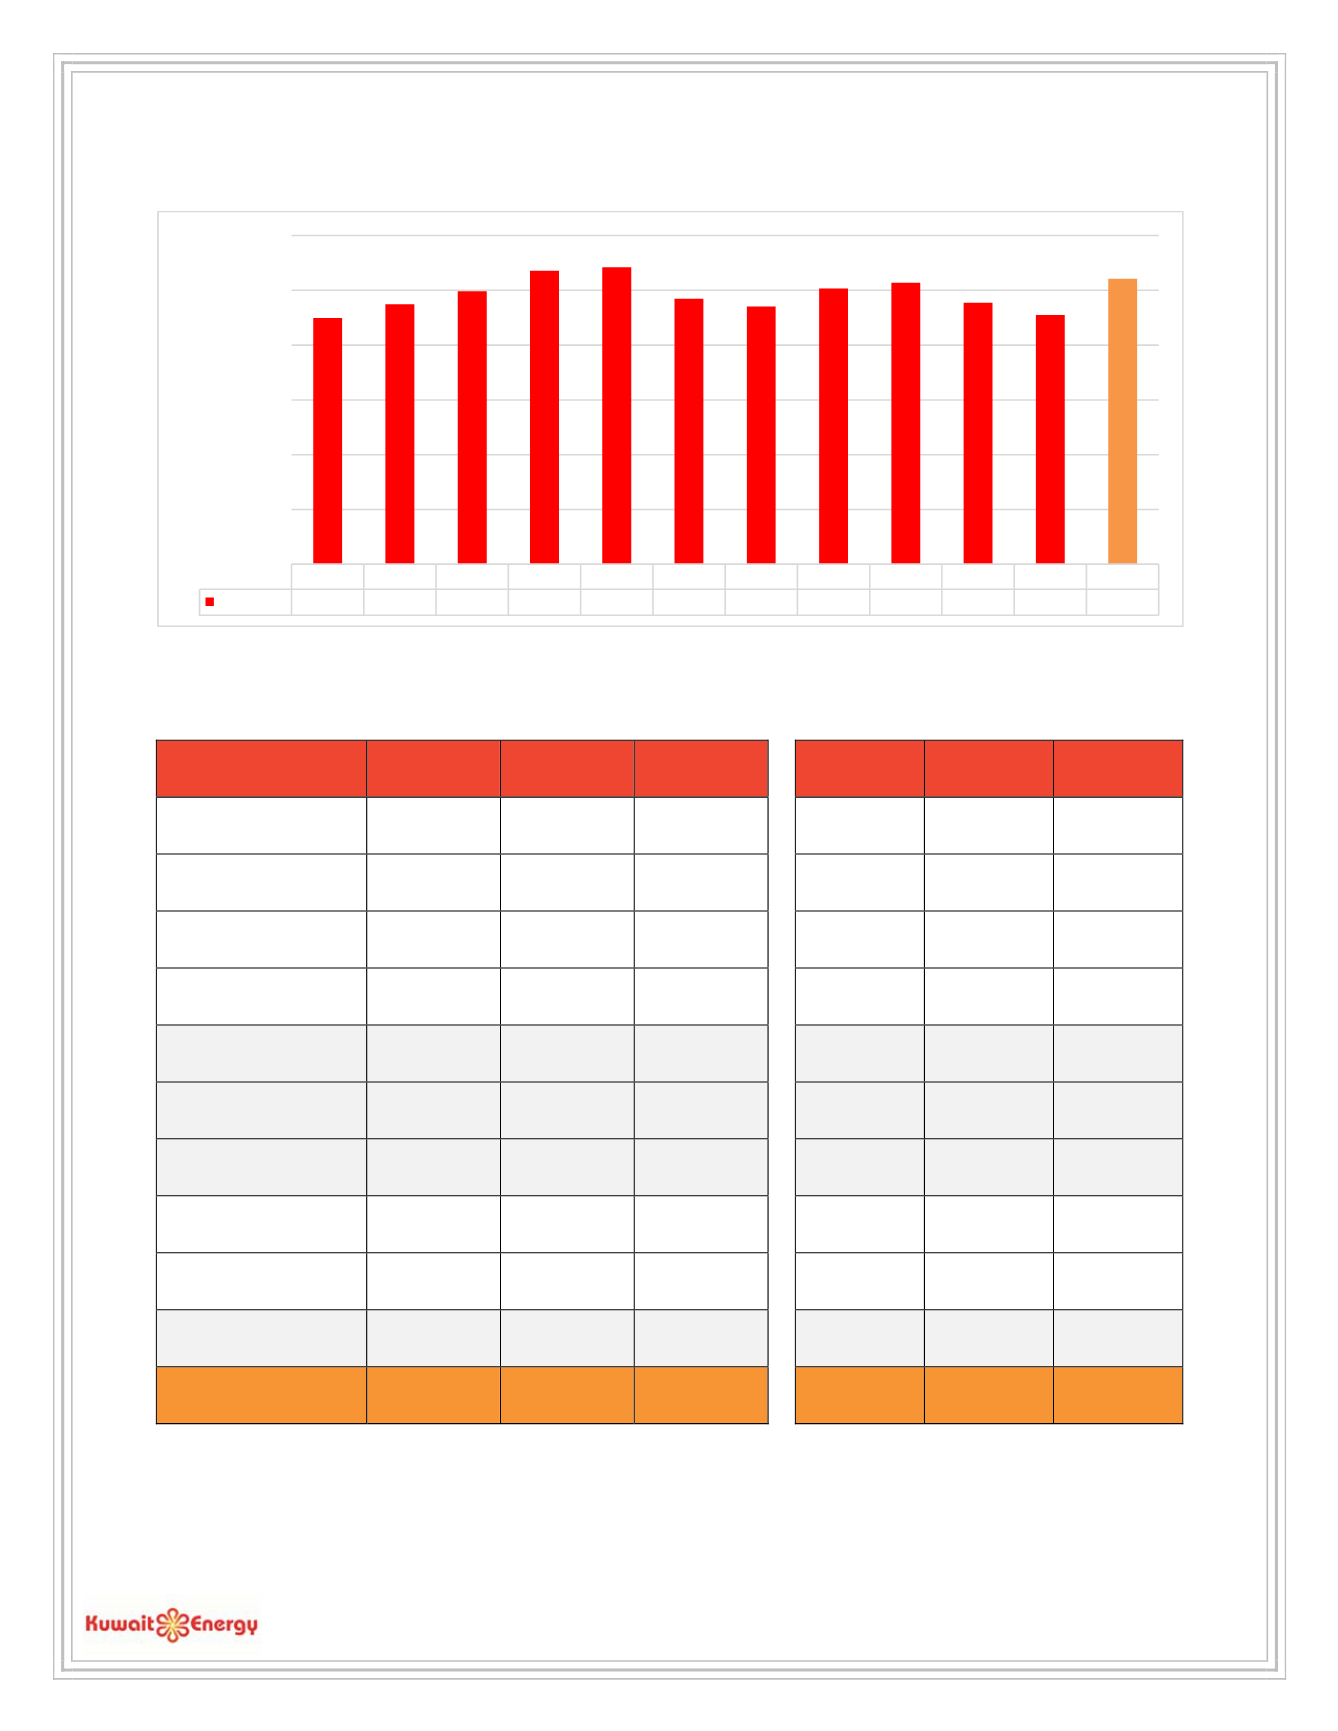
The chart below shows
quarter-by-quarter daily WI average producƟon
of the Company from Q1 2014 to Q4 2016:
Kuwait Energy’s
daily average WI share of producƟon for Q4 2016 compared to Q3 2016,
and
2016
compared to
2015
per asset is shown in the table below (in boepd):
Asset/Country
Q4 2016
Q3 2016
% Change
2016
2015
% Change
Abu Sennan
1,721
1,648
4.4%
1,879
2,994
-37.2%
BEA
1,072
1,267
-15.4%
1,380
1,496
-7.8%
Area A
5,089
5,071
0.4%
5,055
4,567
10.7%
ERQ
9,198
9,467
-2.8%
9,842
11,885
-17.2%
Egypt Total
17,080
17,453
-2.1%
18,155
20,942
-13.3%
Iraq Total (B9)
6,487
2,894
124.2%
3,974
537
640.0%
Oman Total (KSF)
2,475
2,380
4.0%
2,444
2,533
-3.5%
Block 5
0
0
-
0
910
-100.0%
Block 43
0
0
-
0
66
-100.0%
Yemen Total*
0
0
-
0
976
-100.0%
ProducƟon Total
26,041
22,727
14.6%
24,573
24,988
-2.0%
* Yemen producƟon has been suspended since April 2015
Q1 14 Q2 14 Q3 14 Q4 14 Q1 15 Q2 15 Q3 15 Q4 15 Q1 16 Q2 16 Q3 16 Q4 16
Production 22,467 23,720 24,921 26,780 27,099 24,223 23,522 25,151 25,679 23,859 22,742 26,041
0
5,000
10,000
15,000
20,000
25,000
30,000
BOEPD