


 5 / 10

5
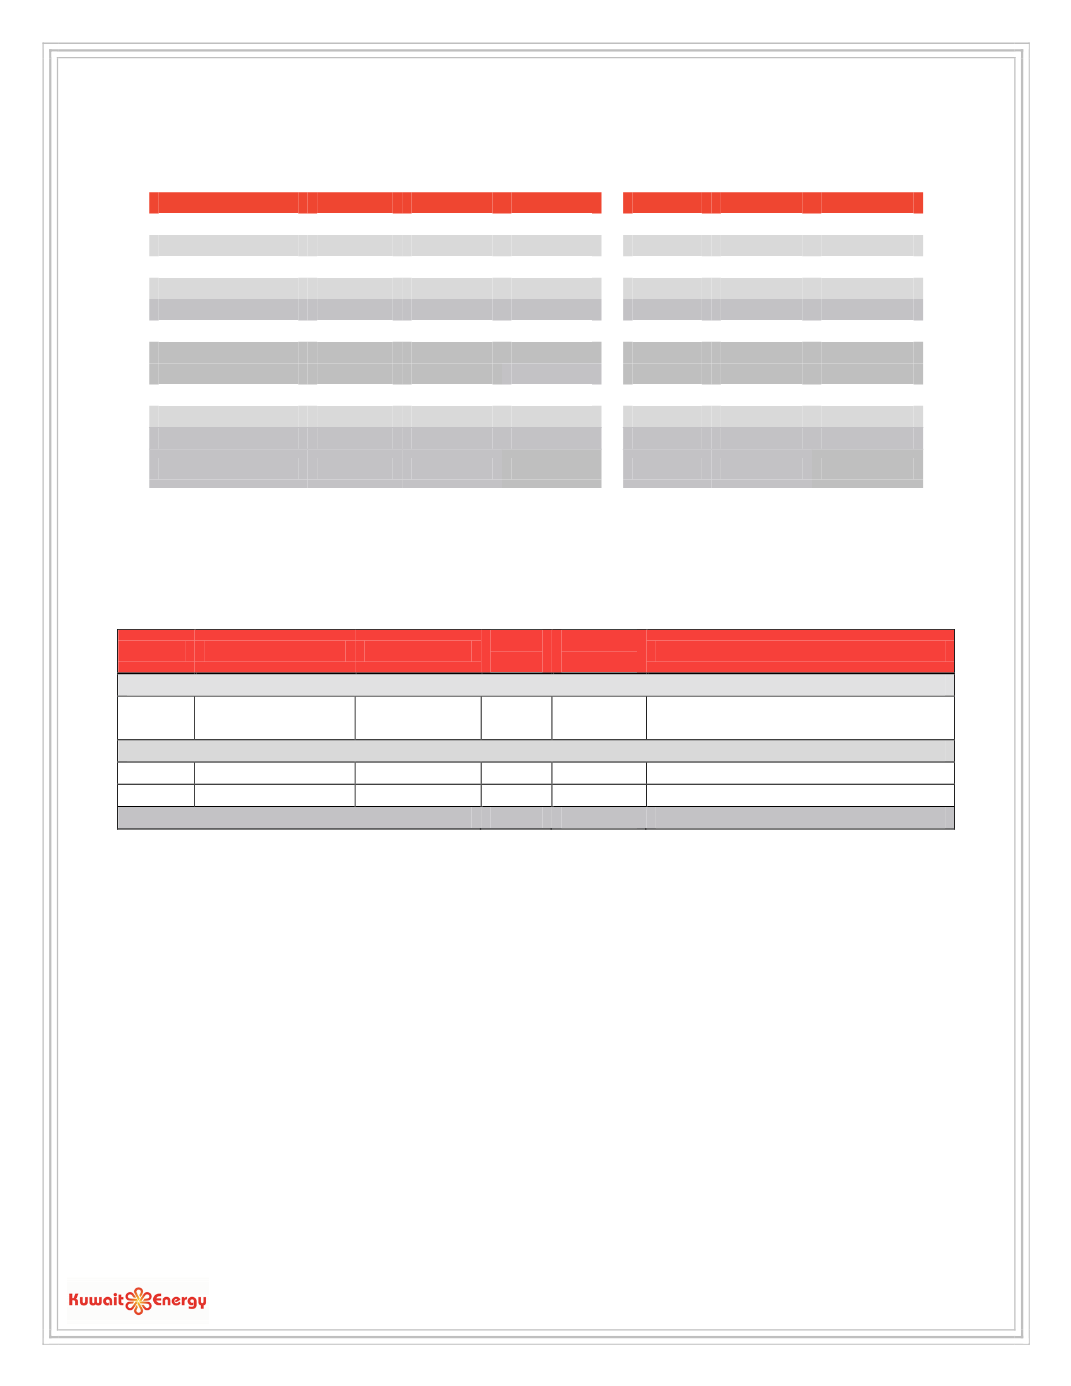
Kuwait Energy’s daily average WI share of production for Q1 2016 compared to Q1 2015 and Q4 2015
per asset is
shown in the table below (in boepd):
Q1 2016
Q4 2015
% Change
Q1 2016
Q1 2015
% Change
BEA
1,677
1,695
-1.1%
1,677
1,282
30.8%
Abu Sennan
2,363
3,029
-22.0%
2,363
2,093
12.9%
Area A
5,045
4,615
9.3%
5,045
4,484
12.5%
ERQ
10,725
11,111
-3.5%
10,725
12,774
-16.0%
Egypt Total
19,809
20,450
-3.1%
19,809
20,634
-2.8%
Block 9
3,396
2,177
56.0%
3,396
0
--
Iraq Total
3,396
2,177
56.0%
3,396
0
--
Oman Total
2,541
2,567
-1.0%
2,541
2,582
-1.6%
Block 5
0
0
--
0
3,618
-100%
Block 43
0
0
--
0
266
-100%
Yemen Total
0
0
--
0
3,883
-100%
Production Total
25,747
25,194
2.2%
25,747
27,099
-5.0%
Development
The main development activities during Q1 2016 included the drilling of Faihaa-2 on Block 9, Iraq and 10
development wells in Oman. The table below provides the status of the development wells at the end of Q1 2016:
Country
Basin/Area
Well name
No. of
Wells
Cost
Interest
Status at end Q1 2016
Q4 2015 Carry-over wells
Oman
Karim Small Fields
Ilham-P22,
SIMSIM-P13
2
15%
On production
Q1 2016
Iraq
Block 9
Faihaa-2
1
60%
On drilling
Oman
Karim Small Fields
Various
10
15%
HJ-P4 and WRDM-K28 on drilling
Total wells spud (2016)
11