


 5 / 10

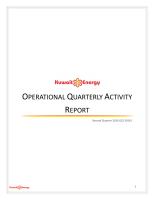
5
Kuwait Energy’s
daily average WI share of production
for
Q2 2016
compared to Q2 2015
and
Q1 2016
per asset is
shown in the table below (in boepd):
Q2 2016
Q1 2016
% Change
Q2 2016
Q2 2015
% Change
Abu Sennan
1,788
2,363
-24.3%
1,788
3,401
-47.4%
BEA
1,509
1,677
-10.0%
1,509
1,563
-3.5%
Area A
5,013
5,045
-0.6%
5,013
4,611
8.7%
ERQ
9,989
10,725
-6.9%
9,989
12,076
-17.3%
Egypt Total
18,299
19,809
-7.6%
18,299
21,652
-15.5%
Block 5
0
0
0.0%
0
73
-100.0%
Yemen Total
0
0
0.0%
0
73
-100.0%
Block 9
3,246
3,396
-4.4%
3,246
0
-
Iraq Total
3,246
3,396
-4.4%
3,246
0
-
Oman Total (KSF)
2,379
2,541
-6.4%
2,379
2,498
-4.8%
Production Total
23,924
25,747
-7.1%
23,924
24,223
-1.2%
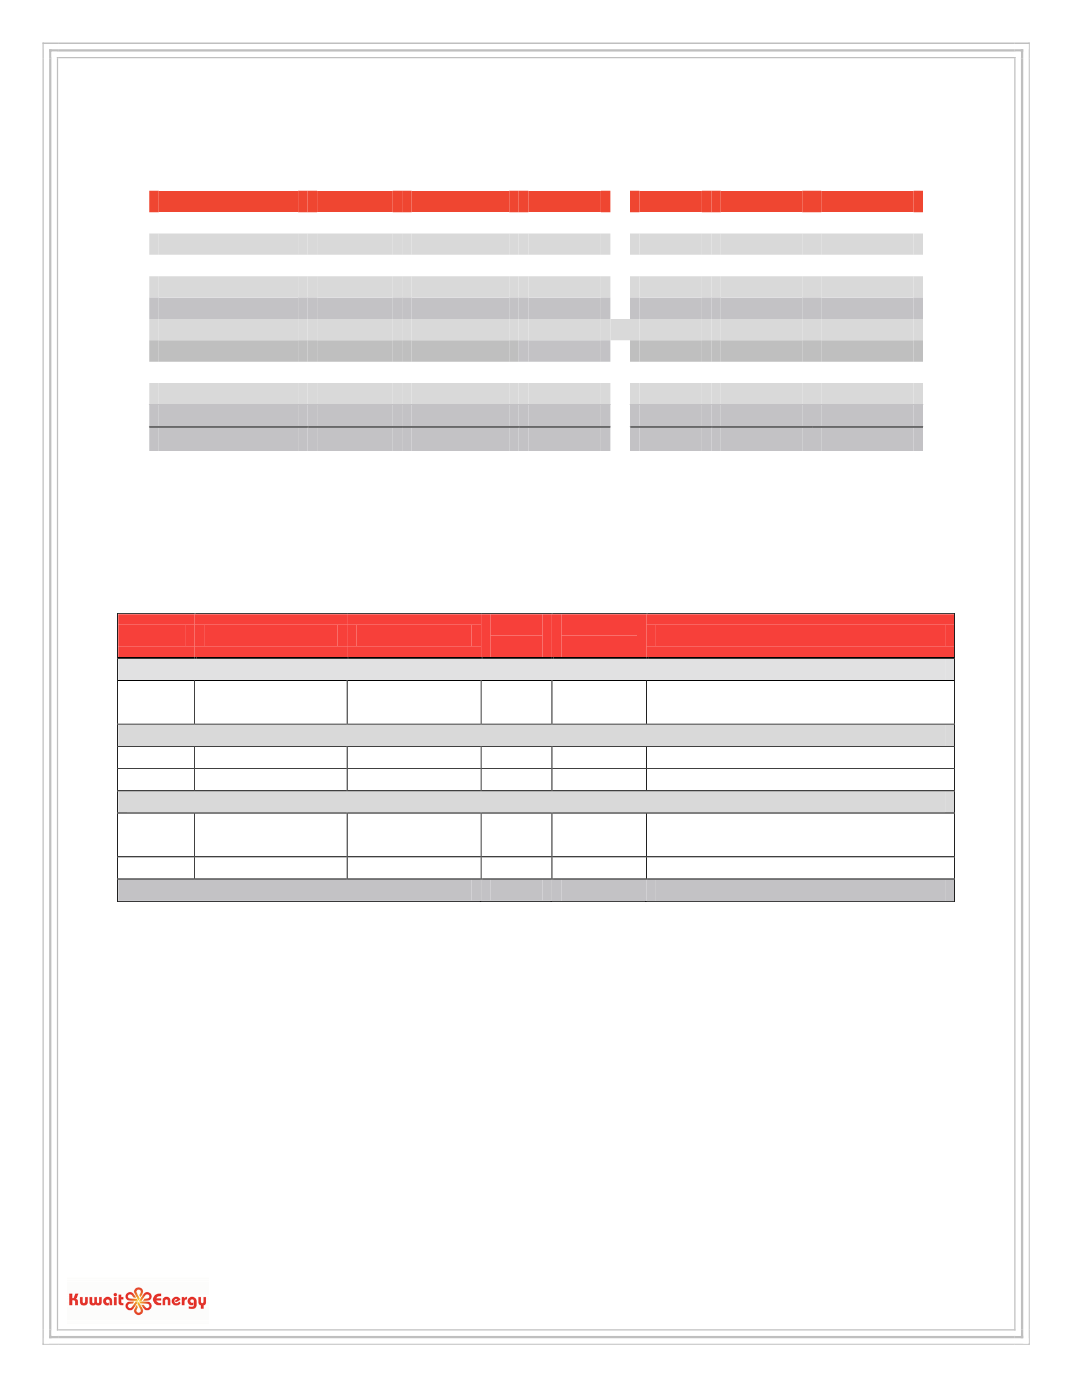
Development & Exploration
The main development and exploration activities during Q2 2016 included the
continued drilling of Faihaa-2
in
Block 9, Iraq and the
drilling of Al Jahraa SE-1X exploration well
which proved to be a
successful discovery
. The
table below provides the status of the development and exploration wells at the end of Q2 2016:
Country
Basin/Area
Well name
No. of
Wells
Cost
Interest
Status at end Q2 2016
Q4 2015 Carry-over wells
Oman
Karim Small Fields
Ilham-P22,
SIMSIM-P13
2
15%
On production
Q1 2016
Iraq
Block 9
Faihaa-2
1
60%
Testing
Oman
Karim Small Fields
Various
10
15%
Producing
Q2 2016
Egypt
Abu Sennan
Al-Jahraa SE-1X
1
78%
Discovery. Awaiting approval to
produce.
Oman
Karim Small Fields
Various
8
15%
Producing / Under Completion
Total wells spud (2016)
20