


 10 / 92

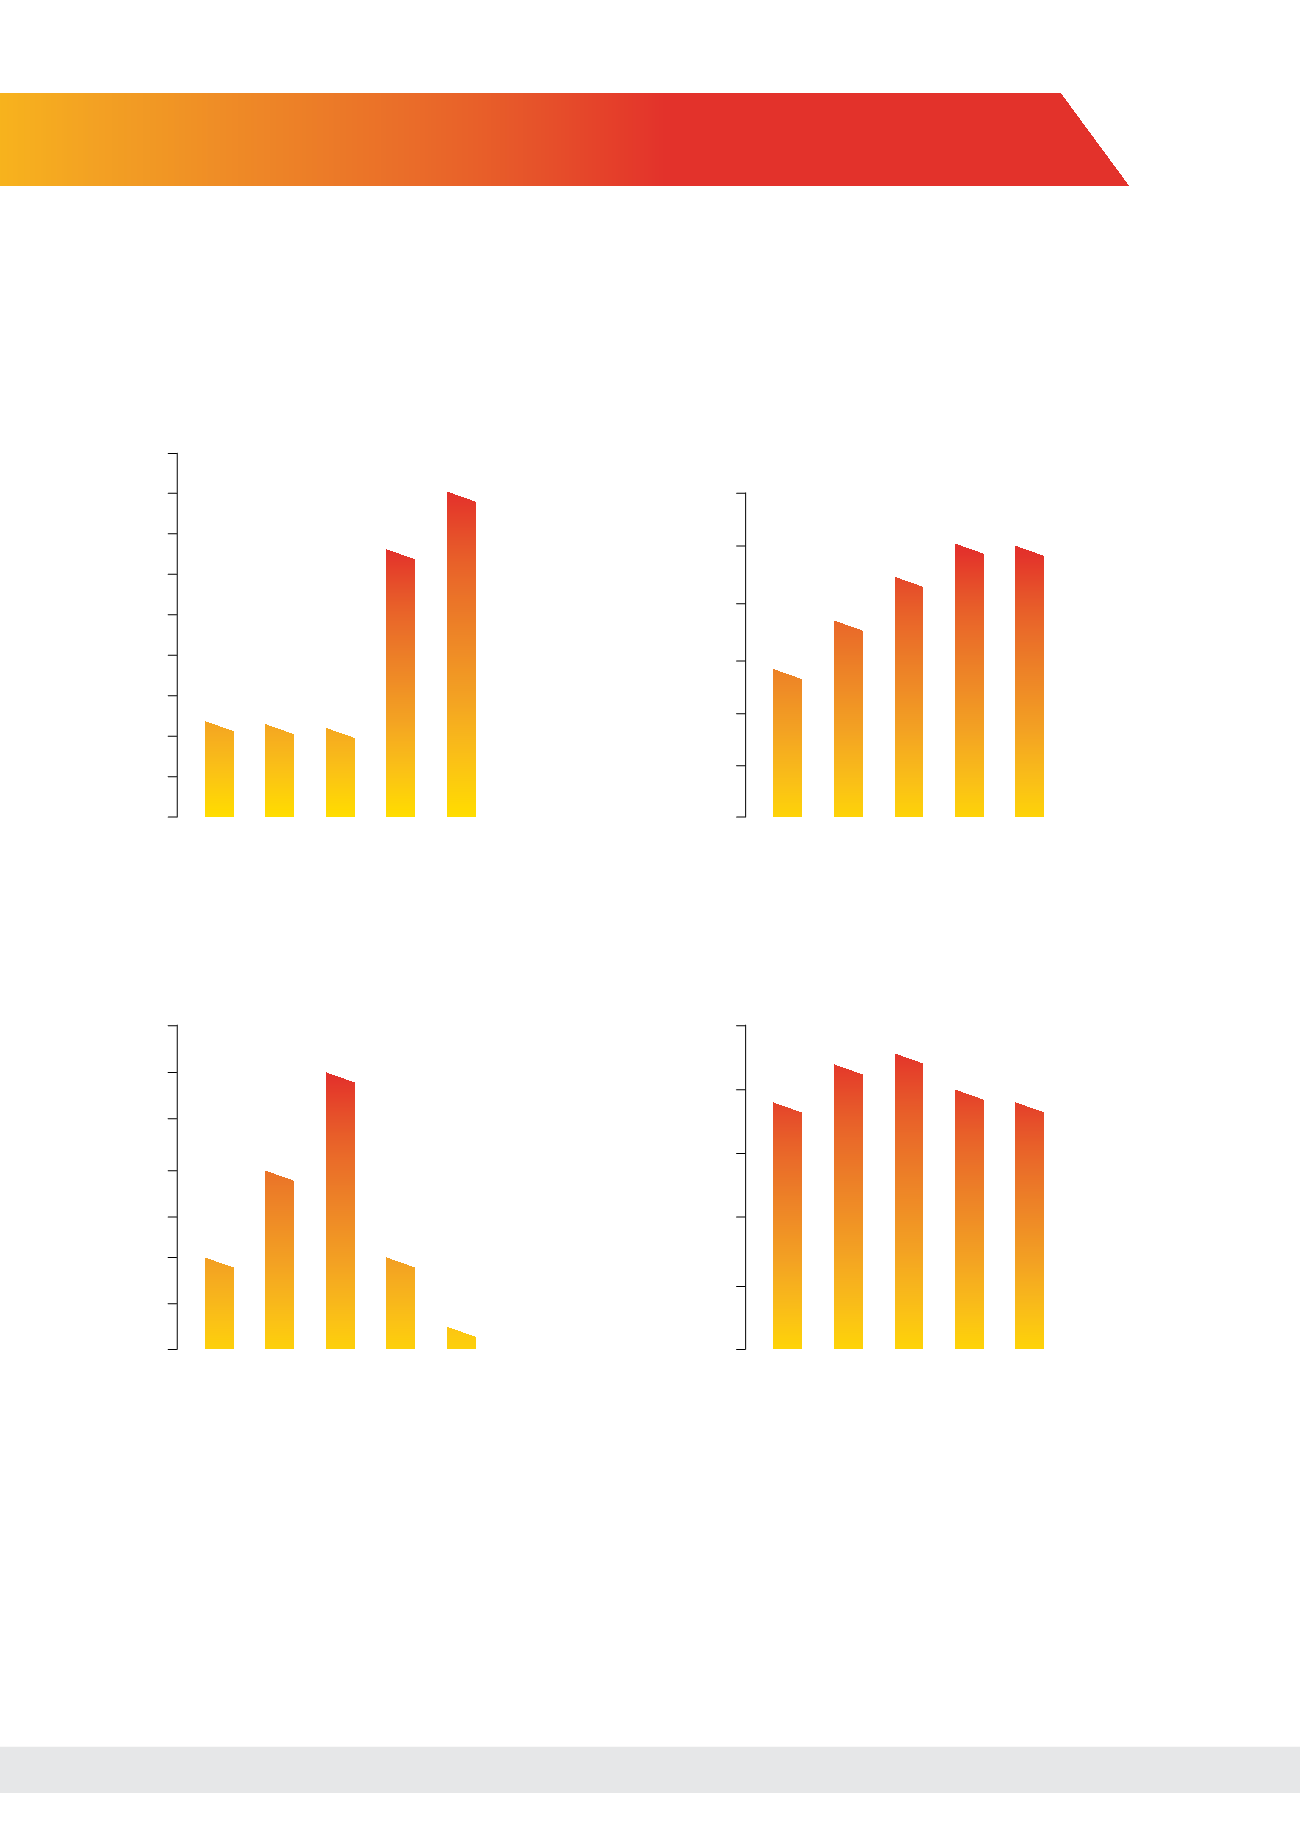
Kuwait Energy Key Figures
0
100
200
300
400
500
600
700
800
900
Proven + Probable WI Reserves (mmboe)
2011 2012 2013 2014
235 222 213
671
0
5
10
15
20
25
30
Daily Average WI Production (boepd)
2011 2012 2013 2014
13,624
17,966
23,360
25,252
0
5
10
15
20
25
Operatorships E&P Leases
2011 2012 2013 2014
19
22
23
20
48
50
52
54
56
58
60
62
Exploration & Production (E&P) Leases
2011 2012 2013 2014
52
56
52
60
Development & Appraisal Wells Drilled
Net Profit/ (Loss) (US$ Million)
2015
19
2015
25,000
2015
49
2015
818
10