


 44 / 67

KUWAIT ENERGY plc
NOTES TO THE CONSOLIDATED FINANCIAL STATEMENTS
For the six months ended 30 June 2014
42
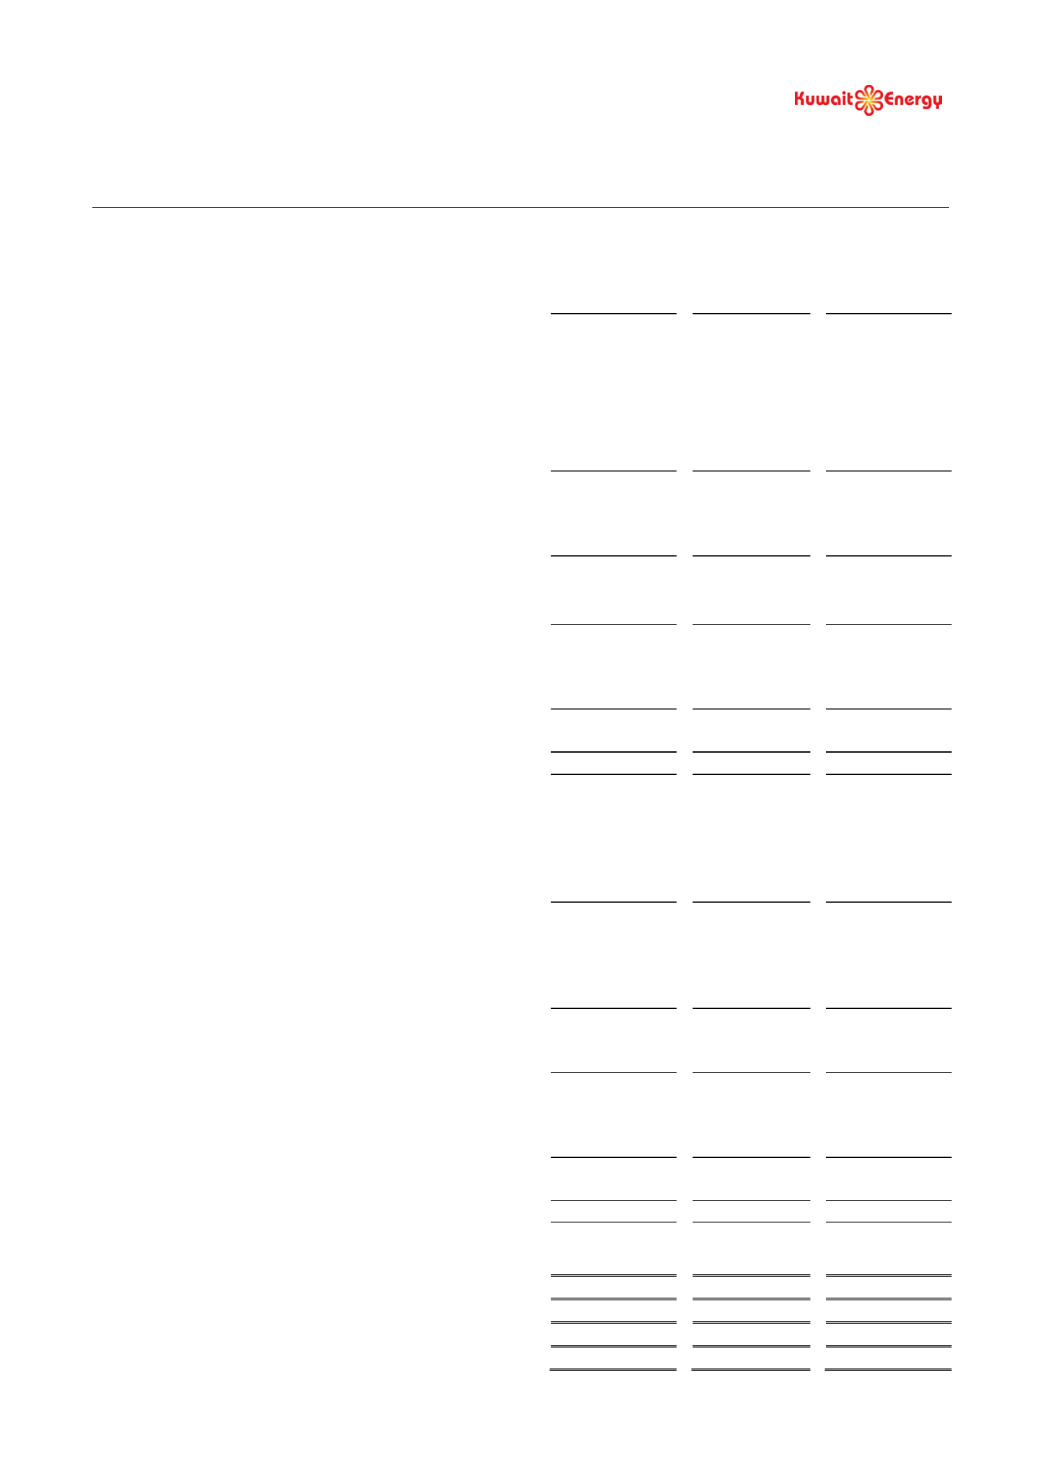
17.
PROPERTY PLANT AND EQUIPMENT
Oil and
gas assets
Other fixed
assets
Total
(Restated)
Cost
USD 000’s
USD 000’s
USD 000’s
As at 1 January 2011
409,095
8,323
417,418
Additions
91,184
2,894
94,078
Transfer from Intangible exploration and evaluation assets
115,675
-
115,675
Write-off of asset in relation to discontinued operations
(5,374)
-
(5,374)
Disposal
(401)
(21)
(422)
Currency translation effect
-
(1)
(1)
As at 31 December 2011
610,179
11,195
621,374
Additions
65,641
3,756
69,397
Write-back of asset in relation to discontinued operations
5,374
-
5,374
Disposal
(762)
(511)
(1,273)
As at 31 December 2012
680,432
14,440
694,872
Additions
46,768
789
47,557
Acquisition of subsidiary (note 15)
128,334
-
128,334
As at 30 June 2013
855,534
15,229
870,763
Additions
51,171
2,080
53,251
Acquisition of subsidiary (note 15)
1,588
-
1,588
Reclassified as held for sale (note 13)
(331,625)
-
(331,625)
As at 31 December 2013
576,668
17,309
593,977
Additions
97,985
511
98,496
As at 30 June 2014
674,653
17,820
692,473
Accumulated Depreciation, depletion, amortisation and impairment
As at 1 January 2011
116,595
1,802
118,397
Charge for the year
30,920
1,307
32,227
Write-off of asset in relation to discontinued operations
(1,308)
-
(1,308)
Disposal
(348)
(11)
(359)
As at 31 December 2011
145,859
3,098
148,957
Charge for the year
48,329
1,888
50,217
Impairment
30,862
-
30,862
Write-back of asset in relation to discontinued operations
1,308
-
1,308
Disposal
(282)
(212)
(494)
As at 31 December 2012
226,076
4,774
230,850
Charge for the period
43,488
989
44,477
Impairment
16,972
-
16,972
As at 30 June 2013
286,536
5,763
292,299
Charge for the period
34,563
923
35,486
Impairment reclassified as held for sale
(15,171)
-
(15,171)
On assets reclassified as held for sale (note 13)
(62,449)
(62,449)
As at 31 December 2013
243,479
6,686
250,165
Charge for the period
37,649
835
38,484
As at 30 June 2014
281,128
7,521
288,649
Carrying amount
As at 30 June 2014
393,525
10,299
403,824
As at 30 June 2013
568,998
9,466
578,464
As at 31 December 2013
333,189
10,623
343,812
As at 31 December 2012
454,356
9,666
464,022
As at 31 December 2011
464,320
8,097
472,417