


 8-9 / 116

9
8
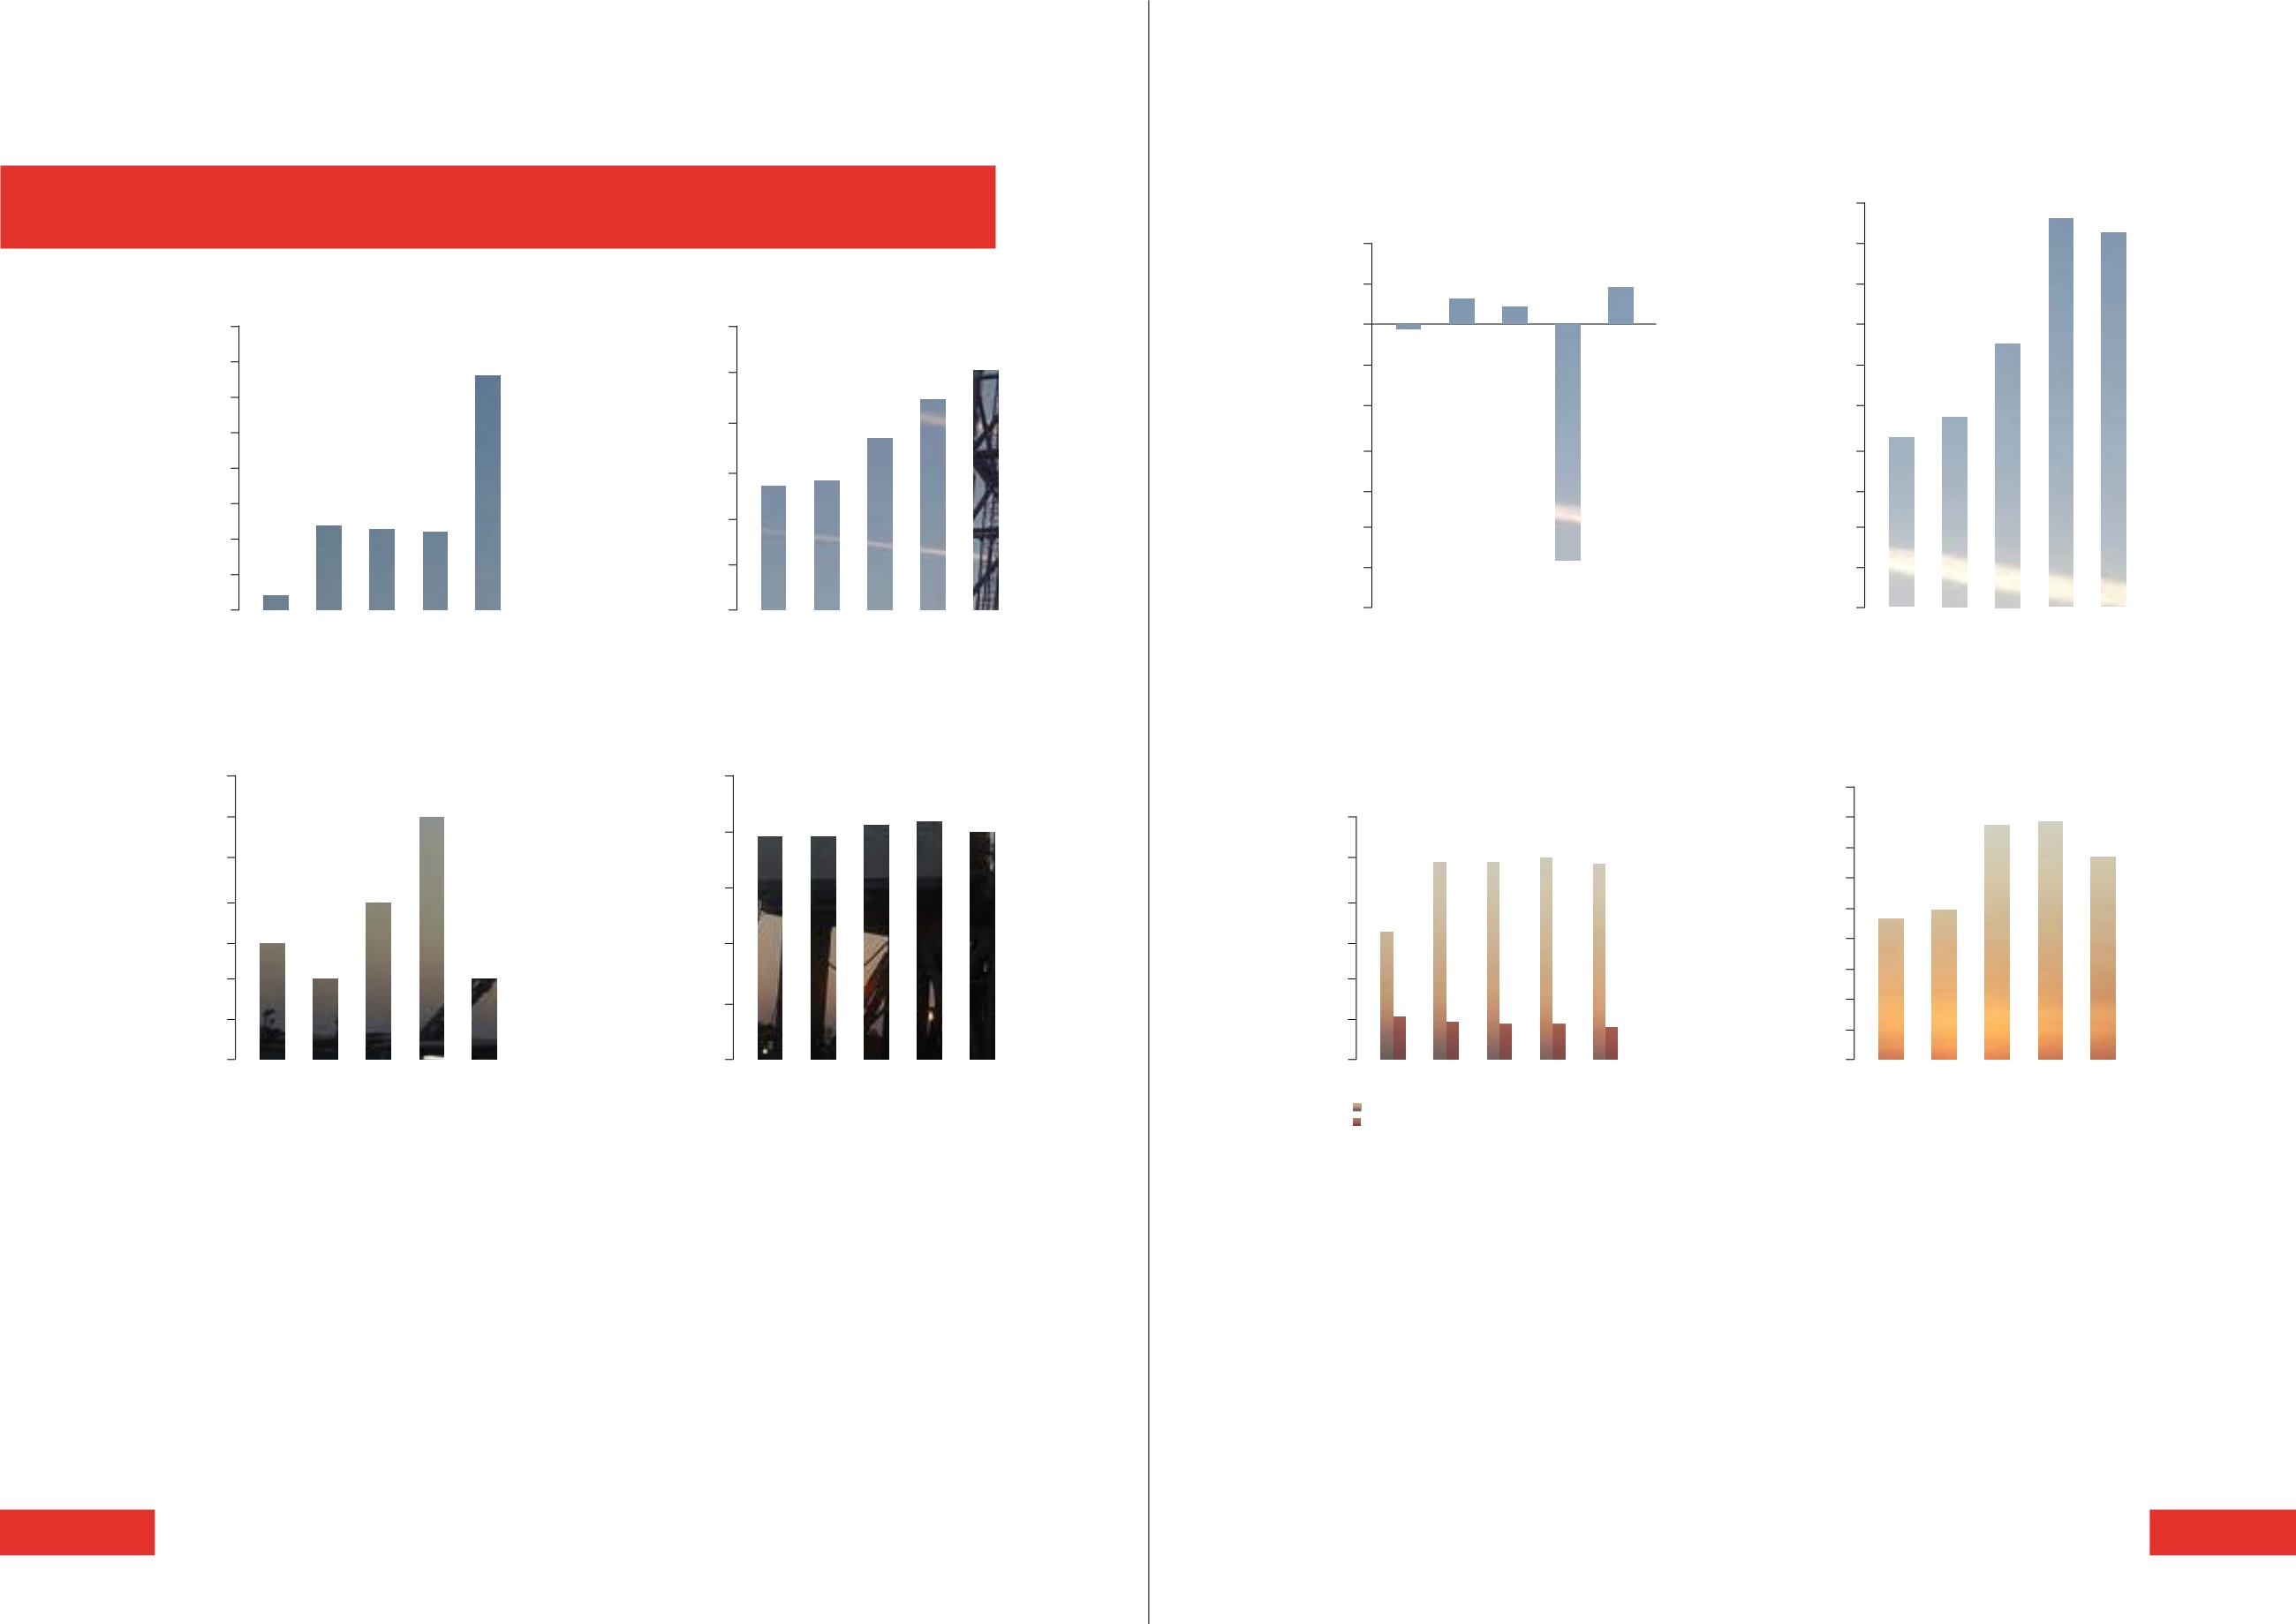
Kuwait Energy Key Figures
0
100
200
300
400
500
600
700
800
Proven + Probable WI Reserves (mmboe)
2010 2011 2012 2013
2014
48.8
235.3 221.6 213.1
671.3
0
5
10
15
20
25
30
Daily Average WI Production (boepd)
(1)
2010 2011 2012 2013
2014
13,258 13,624
17,966
23,360
25,252
0
5
10
15
20
25
Operatorships E&P Leases
2010 2011 2012 2013
2014
19
19
22
23
20
48
50
52
54
56
58
60
62
Exploration & Production Leases
2010 2011 2012 2013
2014
54
52
52
56
60
0
200
400
600
800
100
300
500
700
900
Number of Employees
2010 2011 2012 2013
2014
464 499
762 785
660
(3)
0
10
20
30
40
50
60
Wells Drilled
2010 2011 2012 2013
2014
33
49
49
50
48
11
8
7
7
6
-350
-300
-250
-200
-150
-100
-50
50
100
0
Net Profit
(2)
(US$ Million)
2010 2011 2012
2013
2014
295.8
6.1
31
20
42.7
60
Operating Cash Flow Before Working
Capital Movement
(2)
(US$ Million)
0
20
40
60
80
100
120
160
180
200
140
2010 2011 2012 2013
2014
85.6
95.1
189.9
131.4
182.1
Development and Appraisal Wells
Exploration Wells
2. Financial comparatives have been restated (see Note 2 of the Financial Statement). As in 2014, the Group
retrospectively adopted IFRS 11 Joint Arrangements and changed its accounting policy for intangible exploration
and evaluation assets from ‘modified full cost method’ to a ‘successful efforts method’. Results of 2010 and
2011 further restated to separately show the results of Russia and Ukraine operations, both considered to
represent discontinued operations. Reserves and production numbers are not restated for discontinued
operations. Assets in Ukraine were sold in April 2014 and assets in Russia were sold in November 2014.
3. Number of employees dropped by year-end 2014 due to the sale of assets in Ukraine and Russia.
1. Includes production from assets in Russia and Ukraine that were sold in 2014.