2
3
25
20
15
10
5
0
2011
2010
2009
2008
2007
18
19
17
14
4
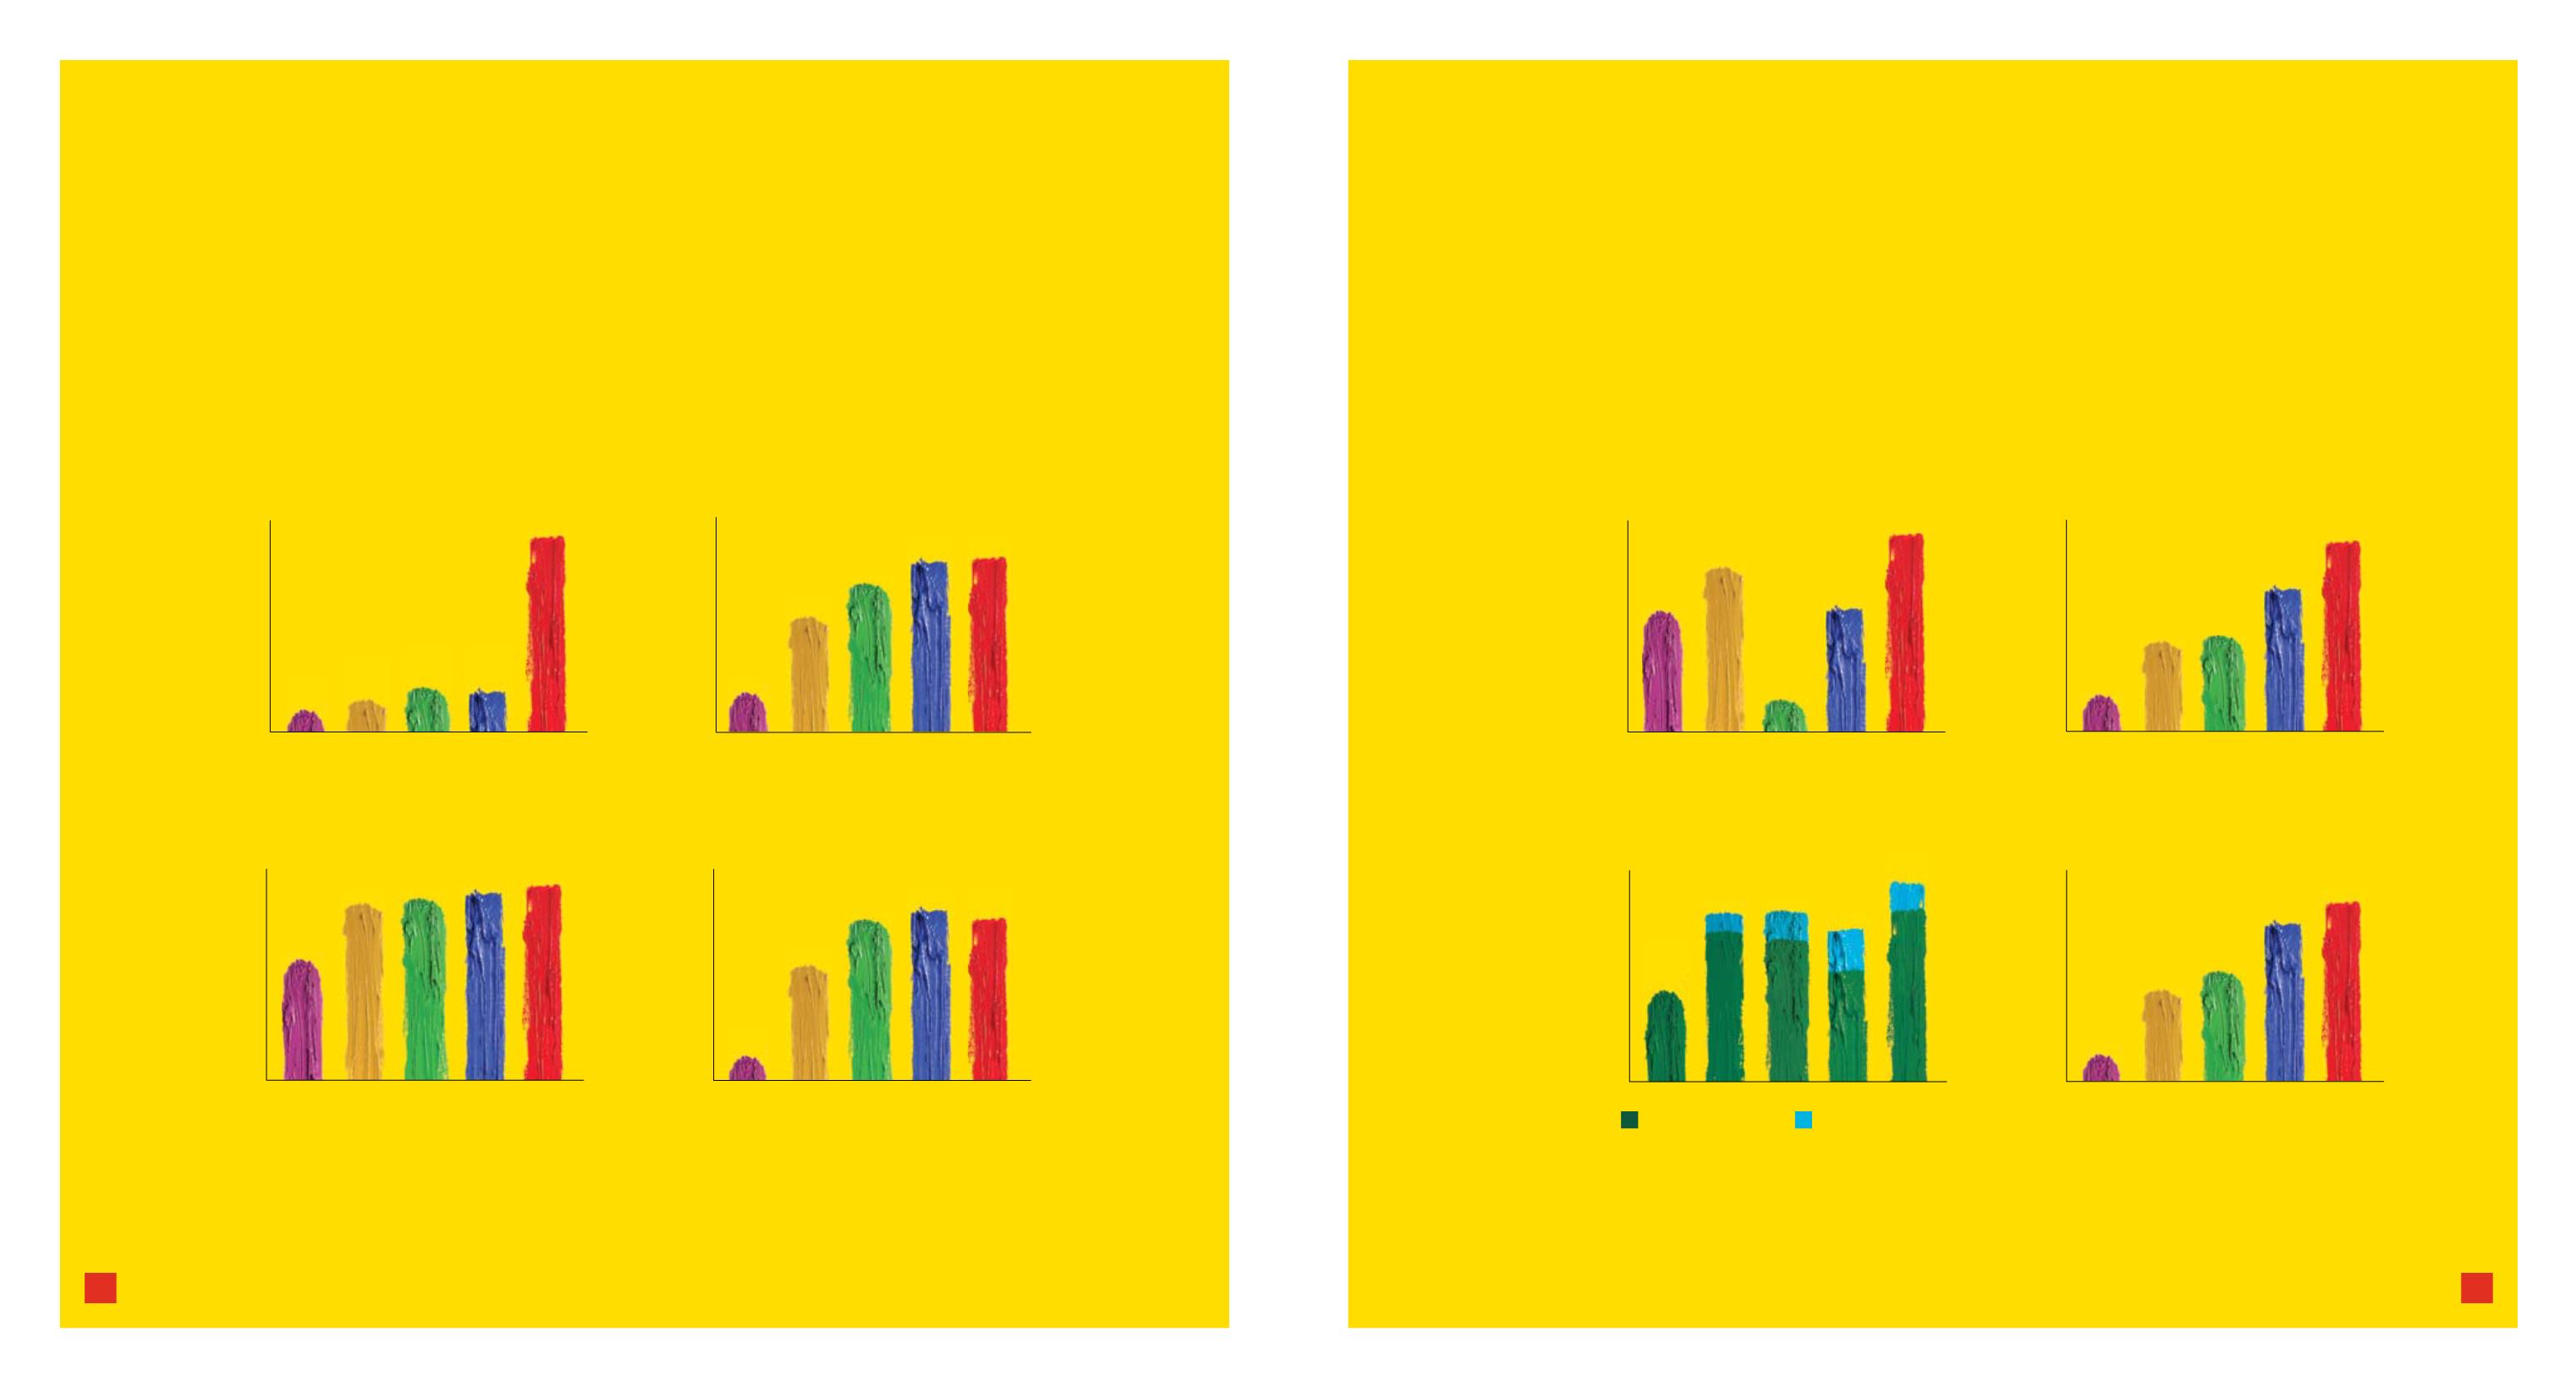
Kuwait Energy Milestones
250
200
150
100
50
0
2011
2010
2009
2008
2007
51.2 48.8
235.3
43.4
34.1
Proven + Probable WI* Reserves (mmboe)
60
50
40
30
20
10
0
2011
2010
2009
2008
2007
53
55
56
52
34
Exploration & Production (E&P) Leases
600
500
400
300
200
100
0
2011
2010
2009
2008
2007
292
464
499
227
63
Number of Employees
35
30
25
20
15
10
5
0
2011
2010
2009
2008
2007
5.6
21.9
34.8
29.9
20.6
Net Profit (US$ MM)
16,000
14,000
12,000
10,000
8000
6000
4000
2000
0
11,499
13,258 13,624
8,160
3,215
Daily Average WI Production (boepd)
120
100
80
60
40
20
0
2011
2010
2009
2008
2007
51.1
85.6
111.9
50.8
17.9
Operating Cash Flow (US$ MM)**
Operatorship (E&P Leases)
* WI means revenue working interest
** The above cashflows are before changes in working capital
60
50
40
30
20
10
0
2011
2010
2009
2008
2007
39
33
49
44
26
Number of Wells Drilled
10
49
11
44
8
57
4
48
Development Wells
Exploration Wells
2011
2010
2009
2008
2007


