Steady Revenue Growth and Profitability
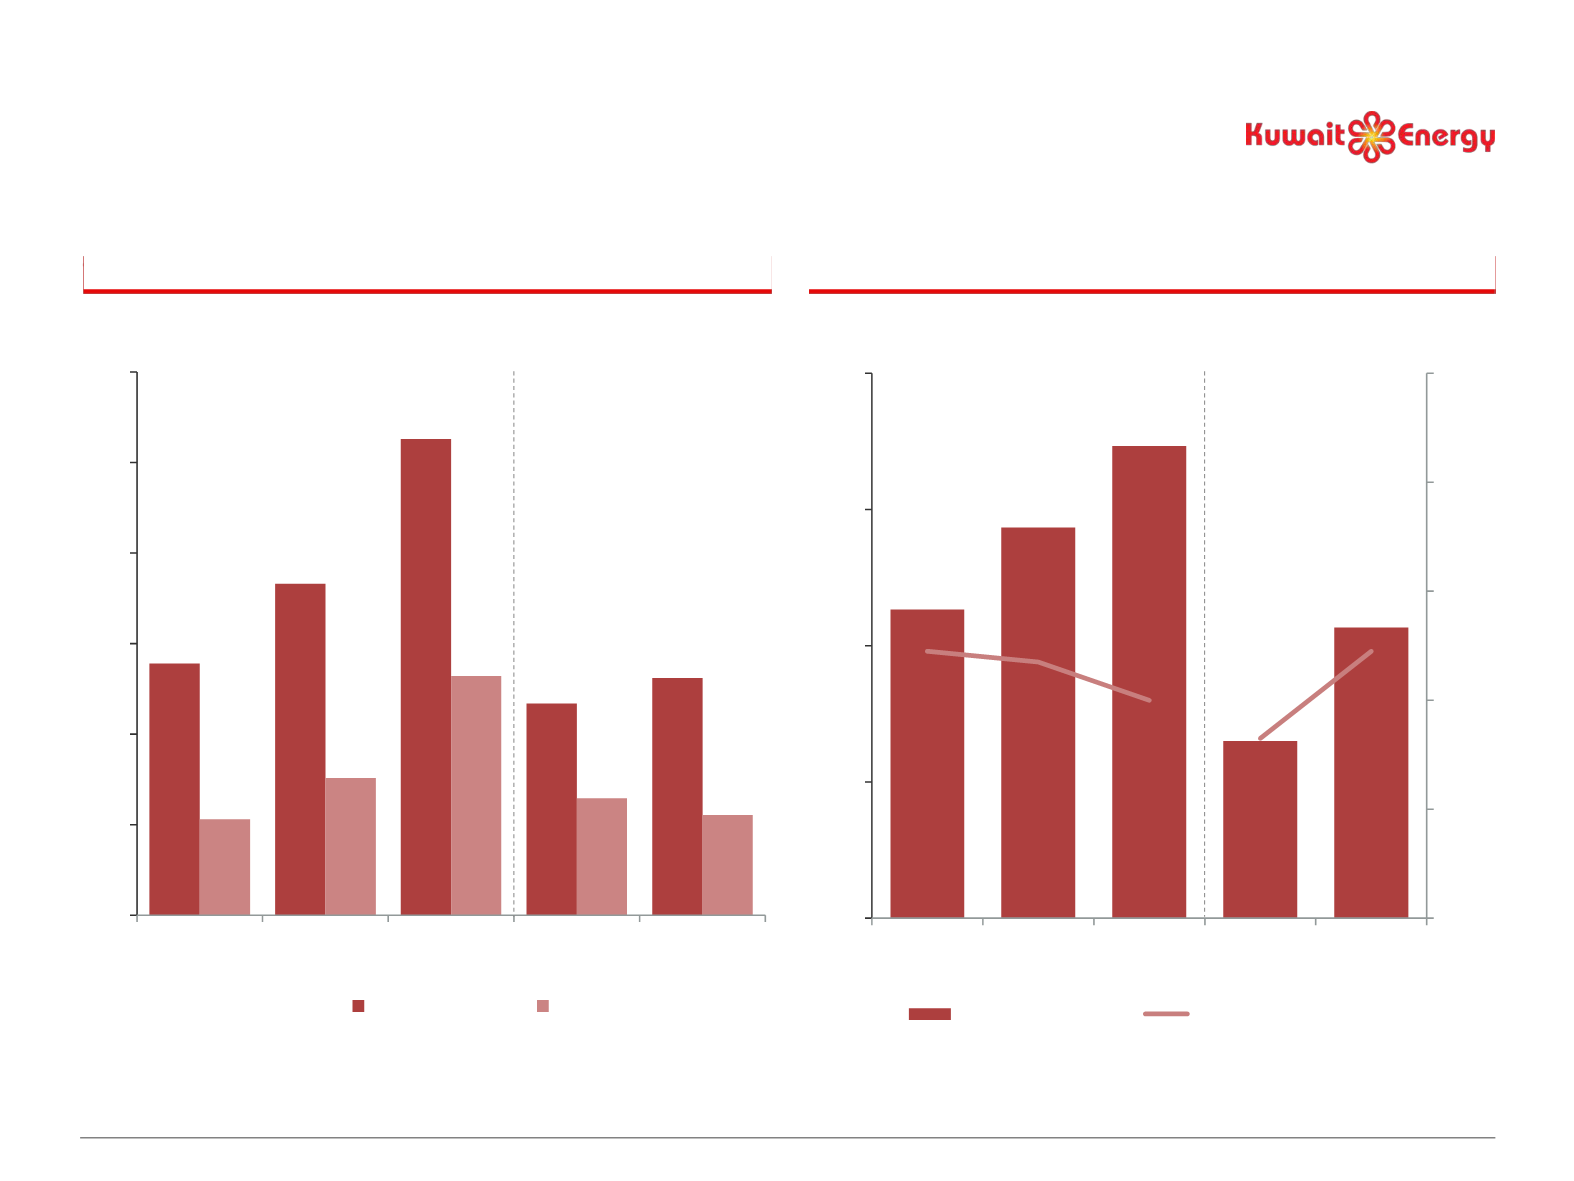
139
183
263
117
131
53
76
132
65
55
0
50
100
150
200
250
300
2011
2012
2013
1H 2013 1H 2014
Revenue
OPEX
68
86
104
39
64
49%
47%
40%
33%
49%
0%
20%
40%
60%
80%
100%
0
30
60
90
120
2011
2012
2013 Q1 2013 Q1 2014
Operating Profit
Operating Profit Margin
$m
$m
(1) Including direct costs and depletion expenses. (2) Operating profit defined differently from OM as it is adjusted for net impairment losses / reversal and exploration expenditure written off
24
Annual
Half Year
Annual
Half Year
(1)
Total Revenue and Cost of Sales
Operating Profit and Operating Margin
(2)


